Page 1 · Daily Flash
Net sales by day — actual vs plan vs prior year
1–16 September 2026, filtered set · selected day view shaded
What this board answers
The three questions in the 6:00 AM email
Subscription · emailed 6:00 AM daily
The flash lands before the first café opens
A Power BI subscription renders this page as a PDF and image at 06:00 ET, every day, to the FP&A and operations distribution — no one opens the workbook, and the numbers match the report exactly because they come from the same model.
Page 2 · Café ranking
40-café illustrative sample of the 300+ networkThe bakery case — every café as a tile, shaded by plan attainment
One shelf per region · tile width = trailing-12-month sales run-rate · colour = net sales vs plan for the selected day view
AUV run-rate vs the $3M benchmark
Trailing-12-month net sales, annualised for cafés open less than a year · top 8 and bottom 5 of the filtered set
New-café ramp by cohort
Average AUV run-rate per cohort with café count · 100+ openings planned for 2026
Page 3 · Product mix
Toast item-level data · category × daypartCategory share by daypart
Net sales share of bread, pastry, cake and beverage for the selected day view
Category totals
Net sales, share and vs plan for the filtered set
Page 4 · Ops & pipeline
Labour from the ERP · openings from development trackingLabour % of net sales by region
Scheduled labour cost ÷ net sales, selected day view · 28% target
Store-count pipeline — open vs in development
Network-level counts by region (illustrative split of the published 300+ open / ~600 in development)
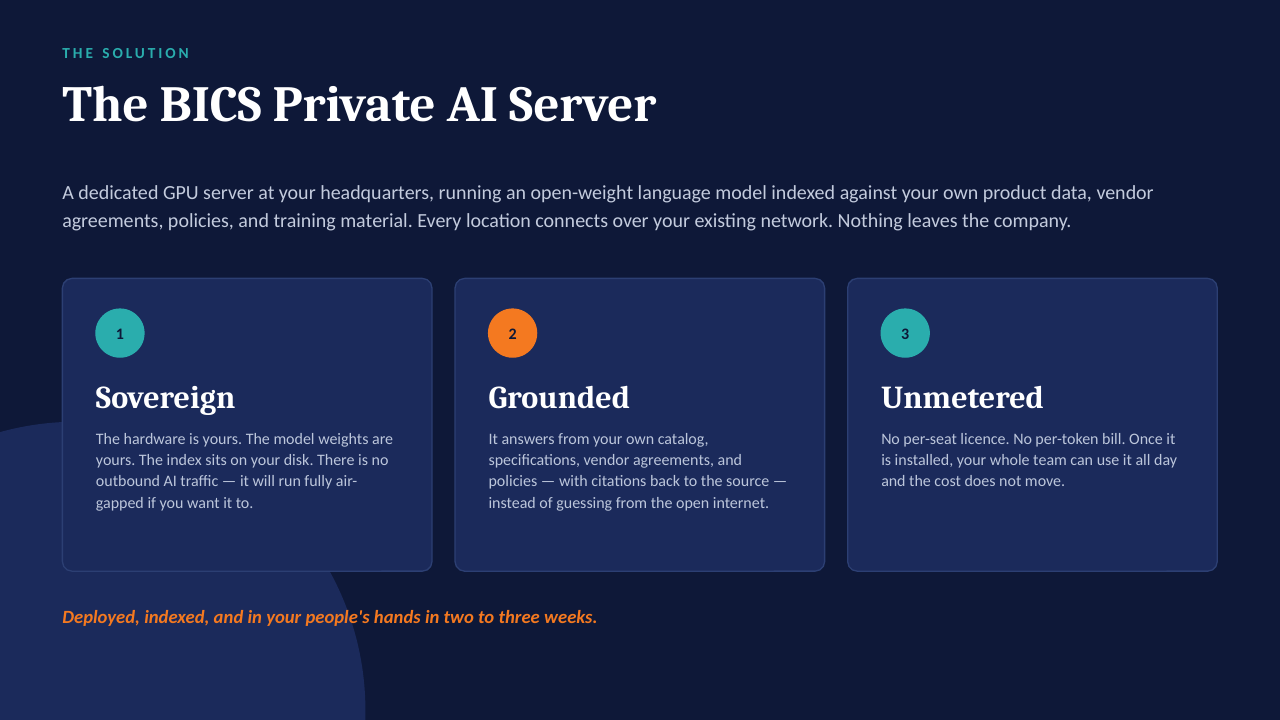
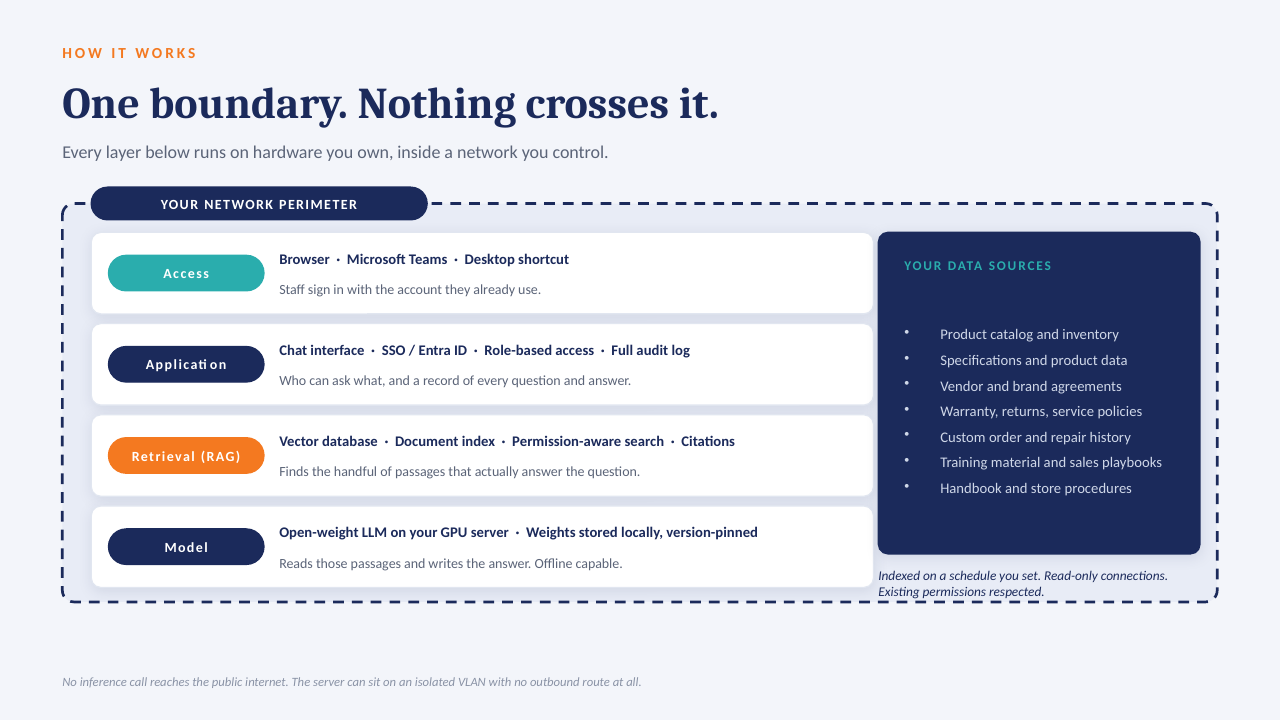
Ask the data · private AI over the Daily Flash model